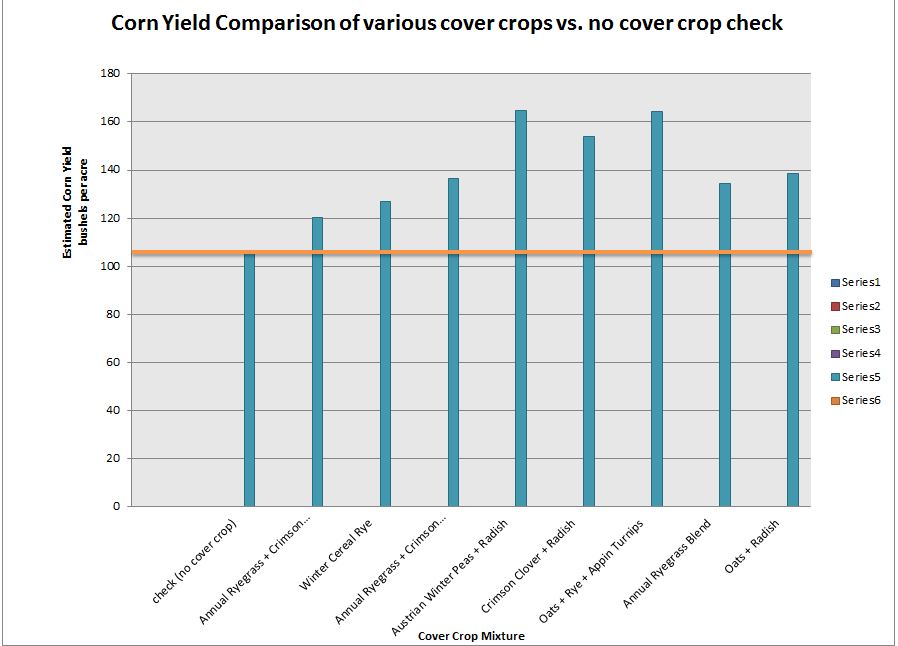
All of what is reported below was accomplished after only one year of cover crops. This work was inspired by a conversation Don and I had last winter with Dr. Eileen Kladivko from Purdue University. As I say in cover crop meetings,
Don’t expect a miracle the first year – but look for one.
Over the exceptionally dry and super hot late-spring/summer months of 2012 my brother Don Robison collected “plant-health” related data on our corn field at Robison Farms near Greenwood, IN. Don took data on the corn from each area of the cover crop plot we planted last fall over the top of a soybean field as well in the “check area” (no cover crop area).
The data he took throughout the summer included plant chlorophyll readings, plant height, and compaction readings. I presented some of the chlorophyll data on the CropLife Webinar and at several cover crop meetings this summer (and more is posted below).
On August 15th Don and I took hand harvested yield checks from each area and from the check area. The data on the corn yield was almost identical to what we found with the chlorophyll data and compaction data. Where we had the healthier plants all season long (more “green-ness” and deeper roots) we had higher yields.
To figure yield we utilized this formula we found at a Purdue University agronomy website.
The area where the plot was had a 24″ water line was installed by the county in 2009; so it was intended to be a “rescue disturbed soil trial”. The corn was not harvested directly over the water line but it was where the soil from the water line was mixed in with the top soil. In 2011 the field was in Soybeans and yielded 48 bushels/acre. In 2010 the field was corn and yielded 198 bushels/acre. The whole field has been no-tilled for most of the past 20 years (there were some years with conventional tillage done – mainly in the early 90’s). 175 Units of N were applied (100 units (28%) with the chemical burn down application early season and 75 units side dressed (28%) in early May).
Rainfall from May 1 to July 31 was 2.24″ (with only 0.75 from May 1 to July 19). There were 42 days over 90 degrees and 8 days over 100 degrees during that time. All time record dry and heat was recorded in July, 2012 in the area.
Don took chlorophyll readings weekly (one week missed in July due to a family vacation). He took 30 chlorophyll readings per plot per sampling date. He also took multiple plant height readings each time as well. He followed the manufacturers instructions on the chlorophyll readings and penetrometer tests. Don spent a lot of time in this field so we could all have this data! Thanks to The CISCO Companies for providing the seed, equipment, and Don’s labor to collect this data.
Observations:
- The plot areas that rated healthier (more green-ness and taller) yielded the best.
- The plots areas where there was less compaction yielded the best
- The plots with annual ryegrass did not fare as well as some others in this drought year – yet was still considerably above the check.
- Not all plots with radish were “top” yielding – however two of the top three yielding plots had legumes plus radish.
- Plots with legumes were generally healthier all season long and their yield reflected that.
- I doubt that the whole field will average over 100 bushels/acre. As with all hand yield tests they are estimates but I believe that the comparison is very accurate.
- The Austrian Winter Peas, Crimson Clover, and Appin Turnips overwintered “beautifully” and were growing aggressively when sprayed at burndown.
- There was a considerable amount of earthworm activity in the cover crop area but only a few earthworms were found in the “check” area. That is unfortunate because 2 acres were covered and 48 acres were not!
- There were more corn roots in the plot areas we dug vs. the check area (watch for a new post coming on this soon).
- There was more moisture in the soil where the cover crop plots were compared to the check area.
- The soil structure was considerably better in each cover crop plot vs. the check area.